There was a moment when I knew that visual tools were more powerful in the hands of learners than the simple boxes, ovals, webs, and arrows that are commonly used for basic brainstorming and graphic organization of ideas.
I had been working with an entire school faculty on fully integrating a model of visual tools into the everyday classroom learning experiences, but also as a foundation for the explicit development of cognitive processes and problem solving for every student, in every content area, at every grade level. In this moment, during a follow up school faculty meeting, a teacher asked me a provocative question that went to the heart of the matter:
“These visual tools may work for most students, but not for all of my students. You see, some are blind. How would you use visual tools with blind students?”
Caught like a deer in the headlights, I had no answer. When I returned a month later, the same teacher played a video recording and handed me five pale yellow, bumpy pages. Her students had used a Braille machine to generate touchable, nonlinear patterns on this special paper, not the typical lines of text. On the video she recorded, one of her blind students shared his unique draft of several maps: a Circle Map for brainstorming context information about a writing topic, a Tree Map for organizing the information into informal categories of themes and details, and a Flow Map for sequencing the themes and details for use in a final writing product. Amazingly, the young boy led his seeing peers in a discussion about the use of the three tools based on distinct and integrated thinking processes.
His “seeing” peers also had been using a variety of visual tools, the only difference being that they could see the patterns of thinking . . . whereas he could feel them. The teacher was delighted with the outcomes, the final writing product, and she reported that all of her students were significantly improving content and conceptual learning-- and importantly for the long term –significantly improving their cognitive processes due to the explicit use of multiple visual tools linked together for thinking in support of a final performance.
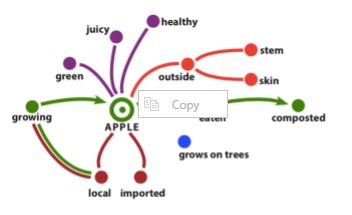
The lesson I learned from this experience was that the array of brainstorming webs, graphic organizers, thinking process maps, concept maps, and systems diagrams—and Thinking Maps® -- are multi-modal and not just visual. For one example, below is an view of visual tools, called Thinking Points © D. Hyerle 2019 that shows the integration of different types of thinking (sequences, categories, physical parts) about a common object:
