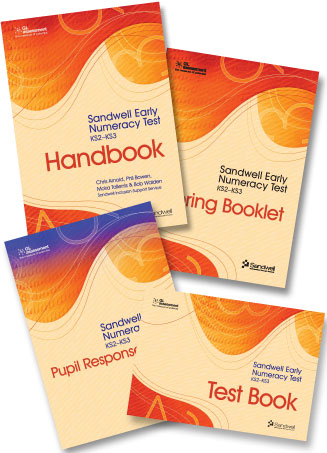
The Sandwell Early Numeracy Test – Revised explores five strands of basic number skills:
1. Identification of numbers
2. Oral counting
3. Value/computation
4. Object counting
5. Language
SENT-R takes between 10 and 30 minutes to complete and provides the teacher with a standard score, age equivalent and percentile rank.
Recommended by the DES and the Every Child Counts programme, SENT-R is hugely popular with schools and early years practitioners.
Every Child Counts describes the Sandwell Early Numeracy Test as an ‘Essential Teacher Resource’ to be used as a standardised baseline test to establish children’s levels of numeracy at the start and end of their programme, and to monitor children’s progress throughout. The assessment is now used within schools in most local authorities.
SENT-R enables practitioners to assess children’s ability with numbers. Designed for use with children from ages 4 years – 7 years 11 months, it explores five strands of basic numeracy skills: identification, oral counting, value, object counting and language, and provides a baseline of a pupil’s number skills. It is particularly useful in helping to identify targets for pupils who are having difficulties with numeracy up to Key Stage Two.
The two parallel tests allow for the monitoring of progress every three months and there is an online marking tool for easy analysis. SENT-R is easy to administer and enjoyable for the children. Images in the test book are engaging and relate to tasks in every day activities. Any member of the school staff who has some basic training can use the tests.
SENT-R includes a one year licence for the Online Marking Tool. Here, you can enter the score obtained by the pupil for each of the five strands of the test and the tool then generates the following five reports:
- Student Listing – this report lists the results for each students (including Raw Score, Standard Age Score (SAS), Stanine, National Percentile Rank, Group Rank and estimated National Curriculum Maths level).
- Group Demographic Comparison – this table shows Raw Score and SAS means and standard deviations for each group of students.
- Comparison of Group and National Stanine Distributions – the bar chart shows the percentage of students that fall within certain ranges of scores.
- Analysis by Strands – the bar chart shows which percentage of pupils fall within different National Curriculum Maths levels for each strand.
- Analysis by Age Equivalent Band – this table shows the percentage of students by age equivalent bands.


